Canadian Federal election polling
In December 2005, during the last Canadian federal election, I wrote about the discrepancies between polls and how they could be partly explained by different notions of what the population of Quebec was. In the 2008 election, there are even larger polling discrepancies -- on October 6th, Nanos reported 6% support for the Green party while Harris-Decima reported 13% support; and once again, certain pollsters consistently disagree with their colleagues.
If you take all of the polls conducted during the 2008 election campaign
and plot them according to their completion dates, you'll get a graph
which looks like this:
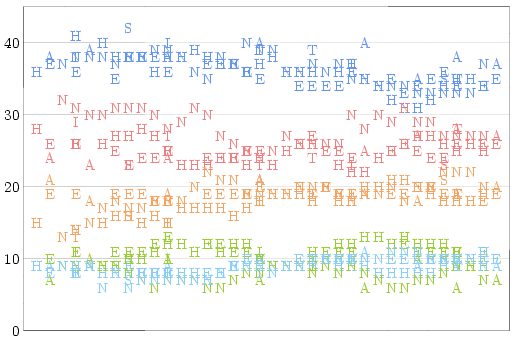
(Different pollsters are represented by different letters: A = Angus
Reid, E = Ekos, H = Harris-Decima, I = Ipsos, N = Nanos, S = Segma, and
T = Strategic Counsel. The different colours represent Conservative
(blue), Liberal (red), NDP (orange), Bloc Quebecois (light blue), and
Green (green) party support respectively.)
Some points on this graph stand out very clearly amidst the noise: For
most of the campaign period, Nanos reports much higher Liberal support
and lower Green support than other pollsters; less noticeably, Angus
Reid reports higher Conservative support and lower Green support. I
threw all of these numbers into a blender, and obtained the following
table of pollster deviations from the consensus:
| Pollster | Conservative | Liberal | NDP | Green | Bloc Quebecois |
| Angus Reid | +1.3% | -1.1% | +1.4% | -1.8% | +0.1% |
| Ekos | -1.1% | -0.6% | +0.5% | +1.2% | +0.2% |
| Harris-Decima | -0.7% | +0.1% | -1.1% | +0.8% | -0.4% |
| Ipsos | +0.8% | +0.4% | -1.9% | +0.2% | -0.1% |
| Nanos | -0.4% | +3.2% | +0.1% | -1.9% | |
| Segma | +2.5% | -2.5% | -0.4% | +0.1% | |
| Strategic Counsel | +2.4% | -1.0% | -1.0% | +0.6% |
Note that these values are the difference between each individual pollster and the polling consensus, not the difference between each pollster and the correct values. It's possible that Nanos and Angus Reid were correct, and the Green party really did have far less support than all the other pollsters thought -- but until the election results come in, all we can do is compare polls to each other.
Once we know how much of a house effect each pollster has compared
to the average pollster, it only makes sense to look at a graph of
"corrected" polls -- and to draw a trend line for each party:
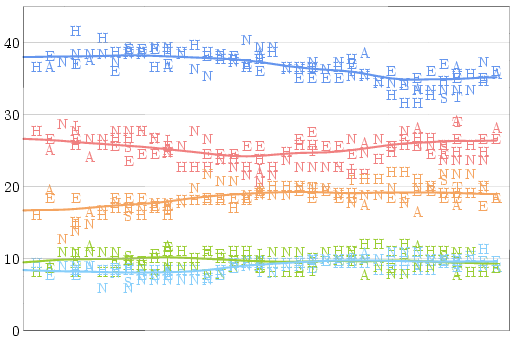
After applying these adjustments, there are no longer wild discrepancies
between polls conducted at the same time. There is some noise, of course,
but that is unavoidable given polls which (even given perfect sampling)
are only accurate to within three percent 19 times out of 20.
Why do different pollsters consistently get results which are a few percentage points apart? There are several reasons, but the largest factor is probably differences in how questions are asked. Harris-Decima asks people to choose between "the Liberal Party candidate, the Conservative Party candidate, etc.", while most pollsters ask people to choose which party they would be most likely to support -- a significant difference given that many Canadians vote for a local candidate they like even if he or she does not belong to their favourite party.
Nanos, however, takes a prize for unusual polling methodology: First, instead of asking for whom someone will vote, they ask people to name their top two choices -- and then arbitrarily designate the first named party as the voter's preference. Second, instead of reading out a list of parties like all the other pollsters do, Nanos uses "top of head" polls: No parties are listed, and it's up to the person being polled to remember what the parties are. It's not hard to imagine that an environmentally-conscious voter would answer "Liberal and Green" when polled by Nanos, but respond "Green" when another pollster asks for a single choice; while a voter who is only marginally aware of the election might support the Green party when prompted, but not even remember that it exists if Nanos phones.
That said, it could be argued that for all of Nanos' shortcomings as polling methodology, it's actually very good as a prediction method: Top-of-head polls effectively underweight responses from people who can't remember the names of all the parties, but those people are less likely to vote anyway; and if a polling method produces results which are biased towards the major parties which people have as their second choices, it might just match the almost inevitable shift on election day when people decide to "vote strategically" instead of "wasting their vote".
What do I expect to see when the final polls close today? 35% Conservative, 28% Liberal, 19% NDP, 7% Green, and 10% Bloc. And the smallest fraction of the popular vote to ever elect a Canadian government.
Four hours from now, I'll see if I'm right -- but now, I'm off to cast my ballot.