High performance single-threaded access to SimpleDB
Last month, Amazon published a code sample which demonstrated the use of SimpleDB as a repository for S3 object metadata. This code sample would probably have gone almost completely unnoticed if it were not for one detail: Using a pool of 34 threads in Java, the code sample sustained 300 SimpleDB operations per second when running on a small EC2 instance. Only 300? We can do better than that...First, rather than using multiple threads, I used a single thread with several TCP connections and non-blocking I/O. The most difficult part of this is the HTTP client code; but fortunately I already had event-driven HTTP client code available which I wrote in order to allow the tarsnap server to access Amazon S3.
Second, I rejected Amazon's recommendation to use exponential back-off when retrying failed SimpleDB requests. While this is appropriate for an application which makes one SimpleDB request at once, it is a poor strategy when making a large number of requests (e.g., when fetching attributes for all of the items returned by a Query operation) for two reasons:
- In the common scenario where request results are not useful until all the requests have been serviced (e.g., when the results are being used to construct a web page), delaying the retry of a failed request by up to 400 ms (as Amazon suggests) is likely to delay the entire operation by up to 400ms, since all the other requests will be done long before the request being retried.
- If multiple threads (34 in Amazon's example) are each issuing one request at once, having one thread wait 400 ms before retrying a request will have little impact on the load placed upon SimpleDB, since the remaining threads (in Amazon's example, 33 out of 34) will continue to issue requests at the same rate.
A better approach, and the one I used, is inspired by TCP congestion control: Allow no more than cwnd simultaneous requests, where cwnd increases gradually if there is no congestion but is cut in half if congestion is detected. My implementation differs from TCP congestion control on the following minor points:
- I do not use slow-start; that is, I start by increasing cwnd linearly rather than exponentially. Experiments indicated that using slow-start tended to result in a large number of requests failing due to timeouts but then clogging up the network as very late responses were sent back by SimpleDB.
- I always use slow-restart; that is, if the number of simultaneous connections drops below cwnd, new connections are started "slowly" (that is, exponentially) rather than all at once. This reduces the danger of severe congestion if other systems have increased their SimpleDB request rate during the period when we were less demanding; and does not run into the problems encountered with slow-start, since when using slow-restart we have a ssthresh value which we know is attainable under good conditions.
- When congestion is detected, the slow-start threshold ssthresh is set to half of the number of requests which were in-flight when the failed request was issued. This is necessary to handle the case where multiple requests fail but one of the failures isn't detected until a network timeout occurs a short time later -- at which point the number of in-flight requests will be significantly lower than the number which triggered the failure.
- When a request fails (either due to an HTTP connection failure, or if an HTTP 5xx status code is received), it is queued to be reissued later (up to a maximum of 5 attempts). In TCP, lost packets must be retransmitted before any progress can be made; but with SimpleDB each request is independent, so there's no need to wait for requests to be retried before making "later" requests.
So how well does this work? I tested with the following sequence of operations from an EC2 small instance and logged the number of requests serviced per second along with the number of simultaneous connections:
- Put 10,000 items, each having 2 attributes.
- Issue a Query with a QueryExpression of "" (which all items match); and for each returned item, Get one of the attributes.
- Issue a Query involving one of the attributes, which is matched by 6971 items; and for each returned item, Get the other attribute.
- Issue a Query involving both attributes, which is matched by 9900 items; and for each returned item, Get both attributes.
- Delete all 10,000 items.
I then plotted the results of this test, with the number of requests serviced per second in green and the number of simultaneous connections in red:
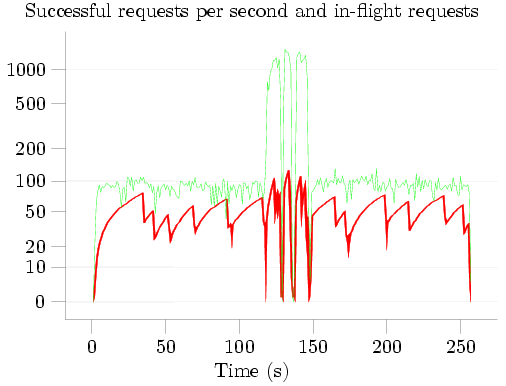
The five phases of the test are clearly visible: about 120 seconds spent Putting items to SimpleDB; three queries lasting approximately 9 seconds, 5 seconds, and 7 seconds respectively; and about 110 seconds Deleting the items from SimpleDB. The characteristic 'sawtooth' pattern of additive-increase-multiplicative-decrease (AIMD) congestion control is visible in red; note that when the first query starts, the congestion window quickly increases -- SimpleDB can apparently handle more simultaneous Gets than simultaneous Puts -- and the successful request rate increases correspondingly until it reached SimpleDB's limit at about 1300 requests per second.
During the initial Put phase, SimpleDB reported a total BoxUsage of 0.219923 hours, i.e., 791 seconds. Given that this phase lasted only 120 seconds, the BoxUsage would indicate that an average of 6 SimpleDB nodes were busy handling the PutAttributes requests at any given time. Even more extreme than this, during the three Queries, when about 1300 GetAttributes calls were being successfully handled each second, the BoxUsage values indicate that an average of over 40 SimpleDB nodes were busy handling the GetAttributes requests. I am, to say the least, rather skeptical of the veracity of these numbers; but as I have already commented on BoxUsage I'll say no more about this.
While a couple of questions remain -- why did I not receive any 503 Service Unavailable errors? Could performance be improved by connecting to several different SimpleDB IP addresses instead of just one? -- one thing is very clear: Using a single thread, non-blocking I/O, and a good congestion control algorithm, it's possible for a single small EC2 instance to successfully issue 50-100 PutAttributes or DeleteAttributes calls per second, and about 1300 GetAttributes calls per second -- over 4 times the rate for which Amazon's code sample received so much attention.
Dissecting SimpleDB BoxUsage
Billing for usage of a database server which is shared between many customers is hard. You can't just measure the size of databases, since a heavily used 1 GB database is far more resource-intensive than a lightly used 100 GB database; you can't just count queries, since some queries require far more CPU time -- or disk accesses -- than others; and you can't even time how long queries take, since modern databases can handle several queries in parallel, overlapping one query's CPU time with another query's disk time. When Amazon launched their SimpleDB service, it looked like they had found a solution in BoxUsage: As the website states,Amazon SimpleDB measures the machine utilization of each request and charges based on the amount of machine capacity used to complete the particular request [...]and reports back a BoxUsage value in every response returned by SimpleDB. Sadly, this "measurement" is fictitious: With the possible exception of Query requests, BoxUsage values returned by SimpleDB are entirely synthetic.
Take creating a domain, for example. Issue a CreateDomain request, and SimpleDB will report back to you that it took 0.0055590278 machine hours -- never 0.0055590277 or 0.0055590279 hours, always exactly 0.0055590278 machine hours. Deleting a domain? Exactly the same: Whether the domain is empty or contains lots of items -- for that matter, even if the domain doesn't exist -- the BoxUsage reported will be exactly 0.0055590278 hours. Listing the domains you have? That costs 0.0000071759 hours -- again, never even a tenth of a nano-hour more or less.
So much for domains; what about storing, retrieving, and deleting data? Issue a PutAttributes call with one attribute, and it will cost 0.0000219909 hours -- no matter if the item already exists or not, no matter if the item name, attribute name, and value are one character long or 100 characters long. Issue a PutAttributes call with two attributes, and it will cost 0.0000219923 hours. Three attributes costs 0.0000219961 hours. Four attributes costs 0.0000220035 hours. See the pattern yet? If not, don't worry -- it took me a while to figure this one out, mostly because it was so surprising: A PutAttributes call with N attributes costs 0.0000219907 + 0.0000000002 N^3 hours. Yes, that's right: The cost is cubic in the number of attributes -- and I can't imagine any even remotely sane algorithm which would end up with an O(N^3) cost.
Retrieving stored data is cheaper: A GetAttributes call which returns N attribute-value pairs costs 0.0000093202 + 0.0000000020 N^2 hours (since the pricing depends on the number of values returned, not the number of values in the item in question, there's good incentive to specify which attributes you're interested in when you send a GetAttributes request). Deleting stored data? Back to cubic again: A DeleteAttributes call with N attributes specified costs 0.0000219907 + 0.00000000002 N^3 hours -- exactly the same as a PutAttributes call with the same number of attributes. Of course, DeleteAttributes has the advantage that you can specify just the item name and not provide any attribute names, in which case all of the attributes associated with the item will be deleted -- and if you do this, the reported BoxUsage is 0.0000219907 hours, just like the formula predicts with N = 0.
The last type of SimpleDB request is a Query: "Tell me the names of items matching the following criteria". Here SimpleDB might actually be measuring machine utilization -- but I doubt it. More likely, the formula just happens to be sufficiently complicated that I haven't been able to work it out. What I can say is that a Query of the form [ 'foo' = 'bar' ] -- that is, "Tell me the names of the items which have the value 'bar' associated with the attribute 'foo'" -- costs 0.0000140000 + 0.0000000080 N hours, where N is the number of matching items; and that even for the more complicated queries which I tried, the cost was always a multiple of 0.0000000040 hours.
Now, there are a lot of odd-looking numbers here -- the variable costs are all small multiples of a tenth of a nano-hour, and the overhead cost of a Query is 14 micro-hours, but the others look rather strange. Convert them to seconds and apply rational reconstruction, however, and they make a bit more sense:
- 0.0055590278 hours = 4803 / 240 seconds.
- 0.0000071759 hours = (31/5) / 240 seconds.
- 0.0000219907 hours = 19 / 240 seconds.
- 0.0000093202 hours = (153/19) / 240 seconds.
Putting this all together, here's what SimpleDB requests cost (at least right now); μ$ means millionths of a dollar (or dollars per million requests):
| Request Type | BoxUsage (hours) | BoxUsage (seconds) | Overhead Cost (μ$) | Variable Cost (μ$) |
|
CreateDomain DeleteDomain | 0.0055590278 | 4803 / 240 | 778.264 | |
| ListDomains | 0.0000071759 | (6 + 1/5) / 240 | 1.005 | |
|
PutAttributes (N attributes specified) DeleteAttributes (N attributes specified) | 0.0000219907 + 0.0000000002 N^3 | 19 / 240 + 0.00000072 N^3 | 3.079 | 0.000028 N^3 |
| GetAttributes (N values returned) | 0.0000093202 + 0.0000000020 N^2 | (8 + 1/19) / 240 + 0.00000720 N^2 | 1.305 | 0.000280 N^2 |
| Query (N items returned) | 0.0000140000 + 0.0000000080 N or more | 0.0504 + 0.00002880 N or more | 1.960 | 0.001120 N or more |
What can we conclude from this? First, if you want to Put 53 or more attributes associated with a single item, it's cheaper to use two or more requests due to the bizarre cubic cost formula. Second, if you want to Get attributes and expect to have more than 97 values returned, it's cheaper to make two requests, each of which asks for a subset of the attributes. Third, if you have an item with only one attribute, and your read:write ratio is more than 22:1, it's cheaper to use S3 instead of SimpleDB -- even ignoring the storage cost -- since S3's 1 μ$ per GET is cheaper than SimpleDB's 1.305 μ$ per GetAttributes request. Fourth, someone at Amazon was smoking something interesting, since there's no way that a PutAttributes call should have a cost which is cubic in the number of attributes being stored.
And finally, given that all of these costs are repeatable down to a fraction of a microsecond: Someone at Amazon may well have determined that these formulas provide good estimates of the amount of machine capacity needed to service requests; but these are most definitely not measurements of anything.
Amazon S3 data corruption
Amazon S3 recently experienced data corruption due to a failing load balancer. While the tarsnap server currently uses S3 for back-end storage, tarsnap was not affected by this.In reviewing how the tarsnap server uses S3 after this problem was uncovered, I realized that tarsnap could theoretically have been affected by this problem; but fortunately Amazon was able to confirm for me that none of the relevant requests went through the afflicted load balancer. Nevertheless, I will be making changes to the tarsnap server in order to detect any data corruption which occurs within S3, in the unlikely event that such a problem occurs in the future.
It's also worth noting that if any data corruption had affected tarsnap, it would not have gone completely unnoticed -- the tarsnap client cryptographically signs archives, so I couldn't give someone a corrupted archive even if I tried. Such corruption would, however, result in an archive restore failing; so there's a clear benefit to making sure that any corruption is discovered before that point (especially in a case of intermittant corruption like this, where retrying a request would probably be sufficient to have the data transmitted without error).
Overall, Amazon does a very good job with its web services; but backups, more than nearly anything else, really need to work -- so the more potential errors I can check for, the better, even if I doubt the checks will ever find anything.
To everything a season
On April 11, 2003, FreeBSD Update was committed to the FreeBSD ports tree. This binary security update system, which started out by supporting FreeBSD 4.7-RELEASE and added support for newer releases as they came out, was the topic of a paper I presented at BSDCan'03 and is probably the leading factor behind my becoming a FreeBSD committer and ultimately the FreeBSD Security Officer. For five years, I distributed updates via update.daemonology.net; but that site has now outlived its purpose, and I have now taken it offline.Starting with FreeBSD 6.2, FreeBSD Update moved from the ports tree into the FreeBSD base system. Associated with this move, updates are now being built on hardware donated to the FreeBSD project rather than hardware which I personally own; and updates are being distributed via update.FreeBSD.org. As such, FreeBSD 6.1 was the last FreeBSD release supported via the version of FreeBSD Update in the ports tree and via update.daemonology.net.
However, FreeBSD 6.1 ceased to be supported at the end of May 2008; and for this reason, there is no longer any need for update.daemonology.net to exist, nor for security/freebsd-update to be in the ports tree -- and while I have not removed it yet, I will be removing that port in the near future.
For those people who are still using it (and I see from my server logs that there are about 600 such systems, many of which are still running FreeBSD 5.3 or 5.4): Wake up, get with the times, and upgrade your systems. FreeBSD 7.0 really is much better; you won't regret upgrading.
UPDATE: In response to a couple of emails, I've brought the bits back up at updateonelastchance.daemonology.net. They will stay here for another two weeks, then they're going to disappear permanently. To use these, change URL=http://update.daemonology.net/ to URL=http://updateonelastchance.daemonology.net/ in /usr/local/etc/freebsd-update.conf.
Daemonic Dispatches: Now with comments
I've resisted allowing people to post comments here for a long time: I always figured that readers could always email me if they wanted; and in any case, allowing users to post comments would have meant writing more code, running CGI scripts (the entire blog is static files, recompiled whenever I want to add or change something), and generally fell into the category of "more work than it's worth". It looks like Disqus might have changed that.A few lines of code added to the "end of post" template; a few lines of code added to the end of each page; and suddenly people can submit comments in response to each of my posts here. We'll see how it goes -- this is an experiment, and I might take Disqus off if it doesn't work out well. But for now, I guess Daemonic Dispatches is joining the 21st century.
Even faster UTF-8 character counting
I recently came across two articles, "Counting characters in UTF-8 strings is fast" by Kragen Sitaker, and "Counting characters in UTF-8 strings is fast(er)" by George Pollard, which provide a series of successively faster ways of (as the article names suggest) counting the number of UTF-8 characters in a NUL-terminated string. We can do better.Kragen takes the approach of examining each byte in sequence and asking if (a) is it the terminating NUL, and (b) is it the first of a UTF-8 character. This last test is quite easy: Bytes 0x01 through 0x7F in UTF-8 represent the corresponding ASCII characters, while bytes 0xC0 through 0xFF are the first byte of a multi-byte character. This results in the following inner loop (modulo some style changes to make it easier to compare this against later versions):
	while (s[i]) {
		if ((s[i] & 0xC0) != 0x80)
			j++;
		i++;
	}
	return (j);
Kragen continues by comparing this to an optimized version written in x86 assembly language by Aristotle Pagaltzis; Aristotle's version cleverly takes advantage of the shl instruction setting the sign, carry, and zero flags, but otherwise applies exactly the same algorithm:
loopa:	dec %ecx
loopb:	lodsb
	shl $1, %al
	js loopa
	jc loopb
	jnz loopa
However, this assembly language version, like Kragen's C version, inspects each of the bytes one by one, which inherently limits the performance.
George Pollard makes the assumption that the input string is valid UTF-8, and notices that by looking at the first byte of a multibyte character, we can determine the length of the character: If the first byte is between 0xC0 and 0xDF, the UTF-8 character has two bytes; if it is between 0xE0 and 0xEF, the UTF-8 character has 3 bytes; and if it is 0xF0 and 0xFF, the UTF-8 character has 4 bytes. After reading the first byte of a multibyte character, George skips over the trailing bytes. He also fast-paths the handling of ASCII characters, treating characters as signed bytes in order to distinguish between ASCII and non-ASCII characters, while giving a wonderful example of using a goto to jump from the middle of one loop into the middle of another:
	while (s[i] > 0) {
ascii:
		i++;
	}

	count += i - iBefore;

	while (s[i]) {
		if (s[i] > 0) {
			iBefore = i;
			goto ascii;
		} else {
			switch (0xF0 & s[i]) {
			case 0xE0:
				i += 3;
				break;
			case 0xF0:
				i += 4;
				break;
			default:
				i += 2;
				break;
			}
		}

		count++;
	}
While this code is considerably faster than both Kragen's C code
and Aristotle's assembly code, it suffers from two performance
limiting factors: First, it uses conditional branches which will
only be consistently predicted correctly if all of the characters
encountered have the same length; and second, it still inspects
characters one by one.
This can be improved in three ways:
- Instead of using conditional branches, identify the initial bytes of UTF-8 characters using logical operations only.
- Instead of handling one character at once, vectorize: Handle lots of bytes in parallel.
- In order to reduce the cost of waiting for memory, prefetch data if possible.
#define ONEMASK ((size_t)(-1) / 0xFF)

static size_t
cp_strlen_utf8(const char * _s)
{
	const char * s;
	size_t count = 0;
	size_t u;
	unsigned char b;

	/* Handle any initial misaligned bytes. */
	for (s = _s; (uintptr_t)(s) & (sizeof(size_t) - 1); s++) {
		b = *s;

		/* Exit if we hit a zero byte. */
		if (b == '\0')
			goto done;

		/* Is this byte NOT the first byte of a character? */
		count += (b >> 7) & ((~b) >> 6);
	}

	/* Handle complete blocks. */
	for (; ; s += sizeof(size_t)) {
		/* Prefetch 256 bytes ahead. */
		__builtin_prefetch(&s[256], 0, 0);

		/* Grab 4 or 8 bytes of UTF-8 data. */
		u = *(size_t *)(s);

		/* Exit the loop if there are any zero bytes. */
		if ((u - ONEMASK) & (~u) & (ONEMASK * 0x80))
			break;

		/* Count bytes which are NOT the first byte of a character. */
		u = ((u & (ONEMASK * 0x80)) >> 7) & ((~u) >> 6);
		count += (u * ONEMASK) >> ((sizeof(size_t) - 1) * 8);
	}

	/* Take care of any left-over bytes. */
	for (; ; s++) {
		b = *s;

		/* Exit if we hit a zero byte. */
		if (b == '\0')
			break;

		/* Is this byte NOT the first byte of a character? */
		count += (b >> 7) & ((~b) >> 6);
	}

done:
	return ((s - _s) - count);
}
How much faster is this? I put together a a slightly improved version of Kragen's benchmark code, using a buffer filled with valid UTF-8 text instead of his more artificial test cases, and ran it on an Opteron 848 @ 2.2 GHz running FreeBSD 7.0-RELEASE-p1 after compiling with gcc 4.2.1 with the -O3 flag set. Some notes to help decipher the output:
-
The function names and their meanings are
- gcc_strlen = the strlen() function as compiled by gcc;
- kjs_strlen = Kragen's non-UTF-8 strlen function;
- cp_strlen = my non-UTF-8 strlen function (not shown here, but see the source code if you're interested);
- kjs_strlen_utf8 = Kragen's UTF-8 character counter;
- gp_strlen_utf8 = George's UTF-8 character counter; and
- cp_strlen_utf8 = my UTF-8 character counter.
- The test strings are "hello, world", "naïve", and "こんにちは".
- The values printed on each line before the colon are the result computed -- the number of bytes for strlen functions, and the number of UTF-8 characters for strlen_utf8 functions; the values after the colon are the mean and standard deviation time taken in seconds.
The improvement is striking:
testing 33554424 bytes of repeated "hello, world":
                      gcc_strlen =   33554424: 0.034169 +/- 0.000090
                      kjs_strlen =   33554424: 0.049529 +/- 0.000280
                       cp_strlen =   33554424: 0.011357 +/- 0.000030
                 kjs_strlen_utf8 =   33554424: 0.060930 +/- 0.000031
                  gp_strlen_utf8 =   33554424: 0.049675 +/- 0.000294
                  cp_strlen_utf8 =   33554424: 0.014049 +/- 0.000047
testing 33554430 bytes of repeated "na?ve":
                      gcc_strlen =   33554430: 0.034168 +/- 0.000069
                      kjs_strlen =   33554430: 0.049544 +/- 0.000287
                       cp_strlen =   33554430: 0.011348 +/- 0.000021
                 kjs_strlen_utf8 =   27962025: 0.061020 +/- 0.000291
                  gp_strlen_utf8 =   27962025: 0.059726 +/- 0.000029
                  cp_strlen_utf8 =   27962025: 0.014041 +/- 0.000043
testing 33554430 bytes of repeated "?????":
                      gcc_strlen =   33554430: 0.034157 +/- 0.000088
                      kjs_strlen =   33554430: 0.049437 +/- 0.000018
                       cp_strlen =   33554430: 0.011438 +/- 0.000286
                 kjs_strlen_utf8 =   11184810: 0.060919 +/- 0.000032
                  gp_strlen_utf8 =   11184810: 0.027454 +/- 0.000031
                  cp_strlen_utf8 =   11184810: 0.014133 +/- 0.000287
Not only is vectorized character counting faster than the "look at a
byte, skip a few" approach, it isn't even close: Even when the
characters are 3 bytes each (as in the case of
"こんにちは"), the vectorized approach
wins by a factor of 2; and its lead is larger when the skipping
approach can't skip as many bytes. Moreover, vectorized character
counting is only 30% slower than a vectorized strlen and more than
twice as fast as a non-vectorized strlen -- although given that
character counting runs at slightly faster than one byte per clock
cycle, it's not surprising that non-vectorized code can't keep up!
Can we do better? I think so. My code uses 64-bit integer registers to manipulate 8 bytes at once; this is the same size as MMX registers, so those probably won't be very useful, but with SSE2 16 can be manipulated at once, which could provide another doubling of the performance.
Beyond a doubling? Well, the first rule of optimization is to start by finding a good algorithm -- and any algorithm in which the critical path involves counting UTF-8 characters in a 32 megabyte NUL-terminated string is doing something wrong. This is very much a toy problem; but the lesson it teaches is worth remembering: Vectorization is good!