FreeBSD on EC2
FreeBSD doesn't run on Amazon's Elastic Compute Cloud service right now. I want to change this. I need to talk to other wannabe FreeBSD-on-EC2 users. If this describes you, please contact me.
Hacking the Amazon S3 SLA
The Simple Storage Service (S3) provided by Amazon comes with a Service Level Agreement: If the Monthly Uptime Percentage is between 99% and 99.9%, you get a 10% refund; if the Monthly Uptime Percentage is below 99%, you get a 25% refund. The Monthly Uptime Percentage is computed in a fairly straightforward manner: Divide the month into 5-minute intervals and compute the Error Rate (failed requests divided by total requests, treating 0/0 as 0) for each interval; compute the average Error Rate over all the 5-minute intervals in the month; and subtract this value from 100%.If the probability of a request failing during the n th 5-minute interval is p(n), and the number of requests issued during the n th interval is determined solely by p(n), the expected value of the Monthly Uptime Percentage is 100% minus the average value of p(n) over all the intervals; put another way, you can't cheat by waiting for a high p(n) and then quickly running up the failure count by issuing lots and lots of requests. However, this uncheatability applies only if the number of requests issued is independent of the success or failure of individual requests; if we can see whether one request succeeded before issuing the next one, we can cheat the SLA -- quite extravagently, in fact.
Consider a hypothetical attacker who has a very large amount of data stored on S3, but doesn't need to access it (perhaps said data is a backup of his world domination plans). Consequently, he doesn't have to issue any requests; but if issuing requests will allow him to get a refund via the SLA, said refund will be large enough that the cost of performing the requests doesn't matter in comparison. Furthermore, assume for the purpose of simplicity that S3 has a constant failure rate p for the entire month, and the attacker knows what p is (if necessary, he can figure it out quickly by sending a very large number of requests). Finally, assume that the attacker can issue as many requests as he likes within each 5-minute interval, and that he can see if each request succeeds or fails before deciding whether to issue another request. What should this attacker do to maximize the chance that he will get a refund?
Well, at the beginning of each 5-minute interval, he should issue a request. There's no point not doing this -- if he doesn't issue any requests, he'll get an Error Rate of zero for the interval. Suppose that request fails; should he issue any more requests? Absolutely not: If his first request fails, the attacker has achieved a 100% Error Rate for that 5-minute interval. Suppose the request succeeds; should he issue any more requests? Absolutely: Zero failed requests out of one request means an Error Rate of zero, and issuing more requests can't make that any worse. In fact, no matter how many requests he has made, if he hasn't seen any failures yet, he should issue more requests -- they can't decrease the Error Rate, and they might increase it. This provides a very simple strategy to the attacker: Keep issuing requests until at least one failure occurs.
He can do better than this. Suppose he sees his first error after making 2/p requests; if he stops at that point, he will have an Error Rate of p/2 for the interval, much less than the expected p if he issues a very large number of requests. The value i - pj for increasing values of j, where i, j are the number of failed requests and the total number of requests respectively, behaves as a random walk, and it is well known that a balanced random walk will take positive values infinitely many times with probability one; so no matter how many successful requests he has encountered, if the attacker issues enough requests he will eventually (with probability one) be able to stop with an Error Rate of more than p. This provides a better strategy to the attacker: Keep issuing requests until the Error Rate i/j is greater than p.
Can the attacker do any better than this? Yes. Suppose p = 0.01 and the attacker's 99th request fails. He now has i/j = 0.0101 > p; but suppose he decides to continue making requests. If he gets lucky and encounters another failure within the next 98 requests -- an event with probability 63% -- he will increase his Error Rate. In fact, he has a 50% chance of encountering his second failure within the next 69 requests -- which would give him an Error Rate of 0.0119 or more, which more than balances the less than 50% chance that he will end up with an Error Rate of less than 0.0101. With a bit of thought, we can see that for any p there must be a sequence x[1] , x[2], x[3]... such that the optimal strategy is to stop issuing requests if the i th failure is encountered when less than x[i] total requests have been made.
How can we determine these x[i]? With great difficulty. We can, however, approximate them by considering a continuous limit. Defining F(i, j) as the expected Error Rate if there are currently i failures out of j requests and the optimal strategy is followed, we can define G[i](x) for positive x as the limit, as p tends to zero, of F(i, x/p) * exp(-x) / p, and define X[i] as the limit as p tends to zero of x[i] / p. (Yes, the limits do exist.) This provides us with a series of differential equations: For each i, G[i](x) = exp(-x) * i/x for x <= X[i], and G'[i](x) = - G[i+1](x) for x > X[i].
These differential equations don't appear to have any closed-form symbolic solution, but they can be solved numerically. The first few values X[i] are approximately X[1] = 0.507, X[2] = 1.197, X[3] = 1.950, X[4] = 2.740, X[5] = 3.554, X[6] = 4.386, X[7] = 5.232, X[8] = 6.089, X[9] = 6.956, X[10] = 7.830. Assymptotically, X[i] appears to be approximately i - sqrt(i/2); this shouldn't be surprising, since with probability 1 - epsilon the attacker will encounter i + O(sqrt(i)) failures if he performs i/p requests (where the implicit constant depends on epsilon). Given these values, the attacker's limiting strategy for small p is to stop issuing requests as soon as he has seen i failures out of less than X[i] / p requests within the current 5-minute interval.
How large an expected Error Rate do these strategies produce? Much larger than the p which might be expected.
| Strategy | Expected Error Rate | Minimum p to get a 25% refund | Minimum p to get a 10% refund |
| One request per 5-minute interval | p | 1% | 0.1% |
| Stop after 1 failure | p ln(1/p) / (1-p) | 0.154% | 0.0110% |
| Stop when Error Rate > p | p ln(1/p) + 0.191 p (approximately) | 0.149% | 0.0107% |
| Optimal strategy | p ln(1/p) + 0.292 p (approximately) | 0.147% | 0.0106% |
Speaking of failure rates, what are the request failure rates for S3? The failure rates for GETs and DELETEs are very low -- on the order of one failure per 100,000 requests according to my logs. PUTs, however, are far more prone to failure: In the last six months, I've seen PUT failure rates of 0.030%, 0.449%, 0.089%, 0.085%, 0.192%, and 0.178% respectively. None of these are below the 0.0106% rate needed to avoid paying a 10% refund to our hypothetical attacker, and in three of these months, the error rate was high enough that our attacker would have received a 25% refund.
S3 is a great service... but if Amazon wants to avoid paying refunds under the SLA, they've got some work to do.
Canadian election results trivia.
After the last Canadian federal election, I posted here with some election results trivia; since Elections Canada has again helpfully provided the (preliminary) results in CSV format, I've now done the same for the 40th Canadian federal election:
- Closest ridings: In the riding of Vancouver South, the Liberal candidate, Ujjal Dosanjh, is currently ahead of the Conservative candidate, Wai Young, by 33 votes. Other close ridings (within 250 votes) are Kitchener-Waterloo (Conservative 48 votes ahead of Liberal), Egmont, (Conservative 62 votes ahead of Liberal), Esquimault-Juan de Fuca (Liberal 68 votes ahead of Conservative), Brossard-La Prairie (Bloc Quebecois 102 votes ahead of Liberal), Brampton West (Liberal 223 votes ahead of Conservative),
- Widest margins of victory: Jason Kenney, the Conservative candidate in Calgary Southeast, achieved the widest margin of victory, coming 35,689 votes ahead of the Green party candidate, Margaret Chandler. Crowfoot, which had the widest margin of victory in the 2006 election, came a close second with the Conservative candidate, Kevin Sorenson, beating the NDP candidate, Ellen Parker, by 35,559 votes. Out of the 12 ridings (including Calgary Southeast and Crowfoot) which were decided by margins of more than 25,000 votes, 10 were Conservative wins in Alberta; the other two were St. John's East, where the NDP candidate, Jack Harris, came 25,670 votes ahead of the Liberal candidate, Walter Noel, and Montcalm, where the Bloc Quebecois candidate, Roger Gaudet, came 25,132 votes ahead of the Liberal candidate, David Gregoire.
- Votes cast: Thanks to a drop in voter turnout, only 13,834,000 votes were cast, almost a million less than in the 2006 federal election; however, thanks to Canada's growing population, this is still the second-most votes ever cast in a Canadian election, narrowly surpassing the 13,667,671 votes cast in the 1993 federal election).
- Votes received by the winning party: Thanks to the reduced voter turnout, the Conservative party received 5,208,000 votes, slightly fewer than the 5,374,000 votes they received in 2006, in spite of increasing their share of the popular vote from 36.3% to 37.6%.
- Votes received by the second-place party: The Liberal party received 3,633,000 votes, or 26.2% of the total; this is the smallest fraction of the popular vote ever received by a second-place party in a minority parliament.
- The Green party did not win any seats, but they improved on their performance in 2006, coming second in five ridings: Calgary Southeast, where they lost to the Conservatives by 35,578 votes; Macleod, where they lost to the Conservatives by 31,173 votes; Wild Rose -- the sole riding where the Green party came second in the 2006 election -- where they lost to the Conservatives by 30,291 votes; Bruce-Grey-Owen Sound, where they lost to the Conservatives by 9,879 votes; and Central Nova, where -- thanks to the Liberals not running a candidate -- the Green leader Elizabeth May lost to Peter MacKay by 5,619 votes. The Green party also managed to come third in 40 ridings.
- In order for the Conservatives to win a majority, they would have needed to win 12 seats more than they did. The 12th closest seat, by fraction of the popular vote, which the Conservatives lost was Western Arctic, where the Conservative candidate received 37.6% of the popular vote compared to the NDP's 41.4%. If we consider a hypothetical "magical bag of votes" which would allow the Conservatives to increase their share of the popular vote equally in every riding across the country, the Conservatives would need to gain 3.8% extra votes in order to win a majority... which would place them at 41.4% of the popular vote, entirely in line with the rule of thumb that 40% is the minimum popular vote required in Canada in order to form a majority government.
- The winning candidate with the most support, as measured by the fraction of the popular vote received, was Kevin Sorenson, the Conservative candidate in Crowfoot, who recieved 81.8% of the votes in his riding.
- The winning candidate with the least support, as measured by the fraction of the popular vote received, was Richard Nadeau, the Bloc Quebecois candidate in Gatineau, who received 29.1% of the votes in his riding, beating the NDP candidate (26.1%) and the Liberal candidate (25.4%) by less than 2000 votes. There are 128 losing candidates across the country who received a greater fraction of the popular vote in their respective ridings than Richard Nadeau received in his.
- The losing candidate with the most support, as measured by the fraction of the popular vote received, was Nettie Wiebe, the NDP candidate in Saskatoon-Rosetown-Biggar, who received 44.4% of the votes in her riding yet fell 253 votes short of the Conservative candidate, Kelly Block, who received 45.4% of the votes. There are 92 winning candidates across the country who received a smaller fraction of the popular vote in their respective ridings than Nettie Wiebe received in hers.
- Candidates receiving more than 50% of the votes: There are 110 candidates who won a majority of the votes in their respective ridings: 79 Conservative candidates, 14 Liberal candidates, 9 Bloc Quebecois candidates, 7 NDP candidates, and 1 independent (Bill Casey, in Cumberland-Colchester-Musquodoboit Valley).
Note to media and blogs: Feel free to republish the above (in part or in whole), giving credit to Colin Percival or a link to this post.
UPDATE: Statistics concerning the fraction of the popular vote
won by individual candidates added on 2008-10-16.
UPDATE: Some statistics adjusted to replace preliminary results
with validated results on 2008-10-17, 2008-10-18, and 2008-10-23.
Canadian Federal election polling
In December 2005, during the last Canadian federal election, I wrote about the discrepancies between polls and how they could be partly explained by different notions of what the population of Quebec was. In the 2008 election, there are even larger polling discrepancies -- on October 6th, Nanos reported 6% support for the Green party while Harris-Decima reported 13% support; and once again, certain pollsters consistently disagree with their colleagues.
If you take all of the polls conducted during the 2008 election campaign
and plot them according to their completion dates, you'll get a graph
which looks like this:
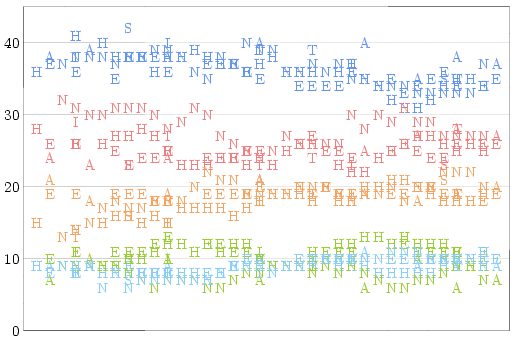
(Different pollsters are represented by different letters: A = Angus
Reid, E = Ekos, H = Harris-Decima, I = Ipsos, N = Nanos, S = Segma, and
T = Strategic Counsel. The different colours represent Conservative
(blue), Liberal (red), NDP (orange), Bloc Quebecois (light blue), and
Green (green) party support respectively.)
Some points on this graph stand out very clearly amidst the noise: For
most of the campaign period, Nanos reports much higher Liberal support
and lower Green support than other pollsters; less noticeably, Angus
Reid reports higher Conservative support and lower Green support. I
threw all of these numbers into a blender, and obtained the following
table of pollster deviations from the consensus:
| Pollster | Conservative | Liberal | NDP | Green | Bloc Quebecois |
| Angus Reid | +1.3% | -1.1% | +1.4% | -1.8% | +0.1% |
| Ekos | -1.1% | -0.6% | +0.5% | +1.2% | +0.2% |
| Harris-Decima | -0.7% | +0.1% | -1.1% | +0.8% | -0.4% |
| Ipsos | +0.8% | +0.4% | -1.9% | +0.2% | -0.1% |
| Nanos | -0.4% | +3.2% | +0.1% | -1.9% | |
| Segma | +2.5% | -2.5% | -0.4% | +0.1% | |
| Strategic Counsel | +2.4% | -1.0% | -1.0% | +0.6% |
Note that these values are the difference between each individual pollster and the polling consensus, not the difference between each pollster and the correct values. It's possible that Nanos and Angus Reid were correct, and the Green party really did have far less support than all the other pollsters thought -- but until the election results come in, all we can do is compare polls to each other.
Once we know how much of a house effect each pollster has compared
to the average pollster, it only makes sense to look at a graph of
"corrected" polls -- and to draw a trend line for each party:
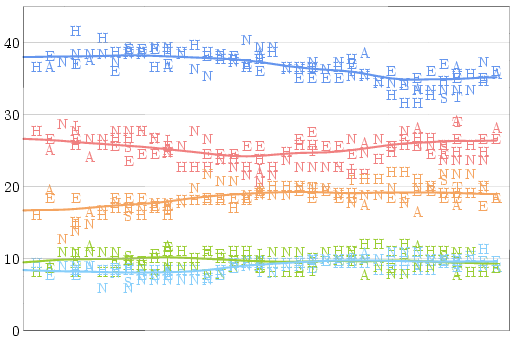
After applying these adjustments, there are no longer wild discrepancies
between polls conducted at the same time. There is some noise, of course,
but that is unavoidable given polls which (even given perfect sampling)
are only accurate to within three percent 19 times out of 20.
Why do different pollsters consistently get results which are a few percentage points apart? There are several reasons, but the largest factor is probably differences in how questions are asked. Harris-Decima asks people to choose between "the Liberal Party candidate, the Conservative Party candidate, etc.", while most pollsters ask people to choose which party they would be most likely to support -- a significant difference given that many Canadians vote for a local candidate they like even if he or she does not belong to their favourite party.
Nanos, however, takes a prize for unusual polling methodology: First, instead of asking for whom someone will vote, they ask people to name their top two choices -- and then arbitrarily designate the first named party as the voter's preference. Second, instead of reading out a list of parties like all the other pollsters do, Nanos uses "top of head" polls: No parties are listed, and it's up to the person being polled to remember what the parties are. It's not hard to imagine that an environmentally-conscious voter would answer "Liberal and Green" when polled by Nanos, but respond "Green" when another pollster asks for a single choice; while a voter who is only marginally aware of the election might support the Green party when prompted, but not even remember that it exists if Nanos phones.
That said, it could be argued that for all of Nanos' shortcomings as polling methodology, it's actually very good as a prediction method: Top-of-head polls effectively underweight responses from people who can't remember the names of all the parties, but those people are less likely to vote anyway; and if a polling method produces results which are biased towards the major parties which people have as their second choices, it might just match the almost inevitable shift on election day when people decide to "vote strategically" instead of "wasting their vote".
What do I expect to see when the final polls close today? 35% Conservative, 28% Liberal, 19% NDP, 7% Green, and 10% Bloc. And the smallest fraction of the popular vote to ever elect a Canadian government.
Four hours from now, I'll see if I'm right -- but now, I'm off to cast my ballot.
UBC Election Stock Market
On September 8th, I invested $25 into the Election Stock Market being run by the University of British Columbia for the 2008 Canadian Federal election. When the market closed, at 10PM PDT on Monday evening, I had increased that to $88.70 (I decided to end up with a cash-only position).This was in fact my second foray into the UBC ESM -- I also participated in the market run for the 2006 Federal election, when managed to turn $25 into $93.08. At 272.3%, that was apparently the largest relative gain, and I suspect that my 254.8% gain this year will once again be the largest relative gain (although I'm sure there are many people who will have made larger absolute gains once the final election results arrive and the market is liquidated). I had hoped to do better in this market than in the last one, but this election campaign wasn't anywhere near as interesting as the 2005/06 campaign -- and it's very hard to make money in a market if nothing ever moves.
So what's my strategy? Automatic trading controlled by a script which checks the market conditions every minute. Lots and lots of automatic trading. I don't have statistics available for the 2006 market, but during the 2008 market I (or rather, my scripts) made 2577 trades worth a total of $21077.73; my average gain per share traded was slightly less than a tenth of a cent.
Depending on the results of today's election, there may be another election -- and another election stock market -- before long. I look forward to seeing how I -- and my scripts -- do next time.