A Canadian payroll dependency chart
The Canada Revenue Agency publishes, on a regular basis (they're now up to the 119th edition), a document entitled "Payroll Deductions Formulas". This document contains all of the formulas needed to calculate payroll deductions collected by the CRA: Canada Pension Plan, Employment Insurance, and Income Tax. As someone running a small business in Canada and not wanting to use an external payroll provider, I implement these formulas myself in a spreadsheet.Unfortunately, like most aspects of the tax system, this steadily increases in complexity, and this year with the Canada Pension Plan including not just "base" premiums and "additional" premiums but also "second additional premiums", I needed to rewrite my spreadsheet from scratch; and also very unfortunately, the authors of the document have failed to grasp an essential detail of software: You have to calculate values before you use them. This results in a document requiring constant jumping back and forth to find where each value is calculated — before or after it is used.
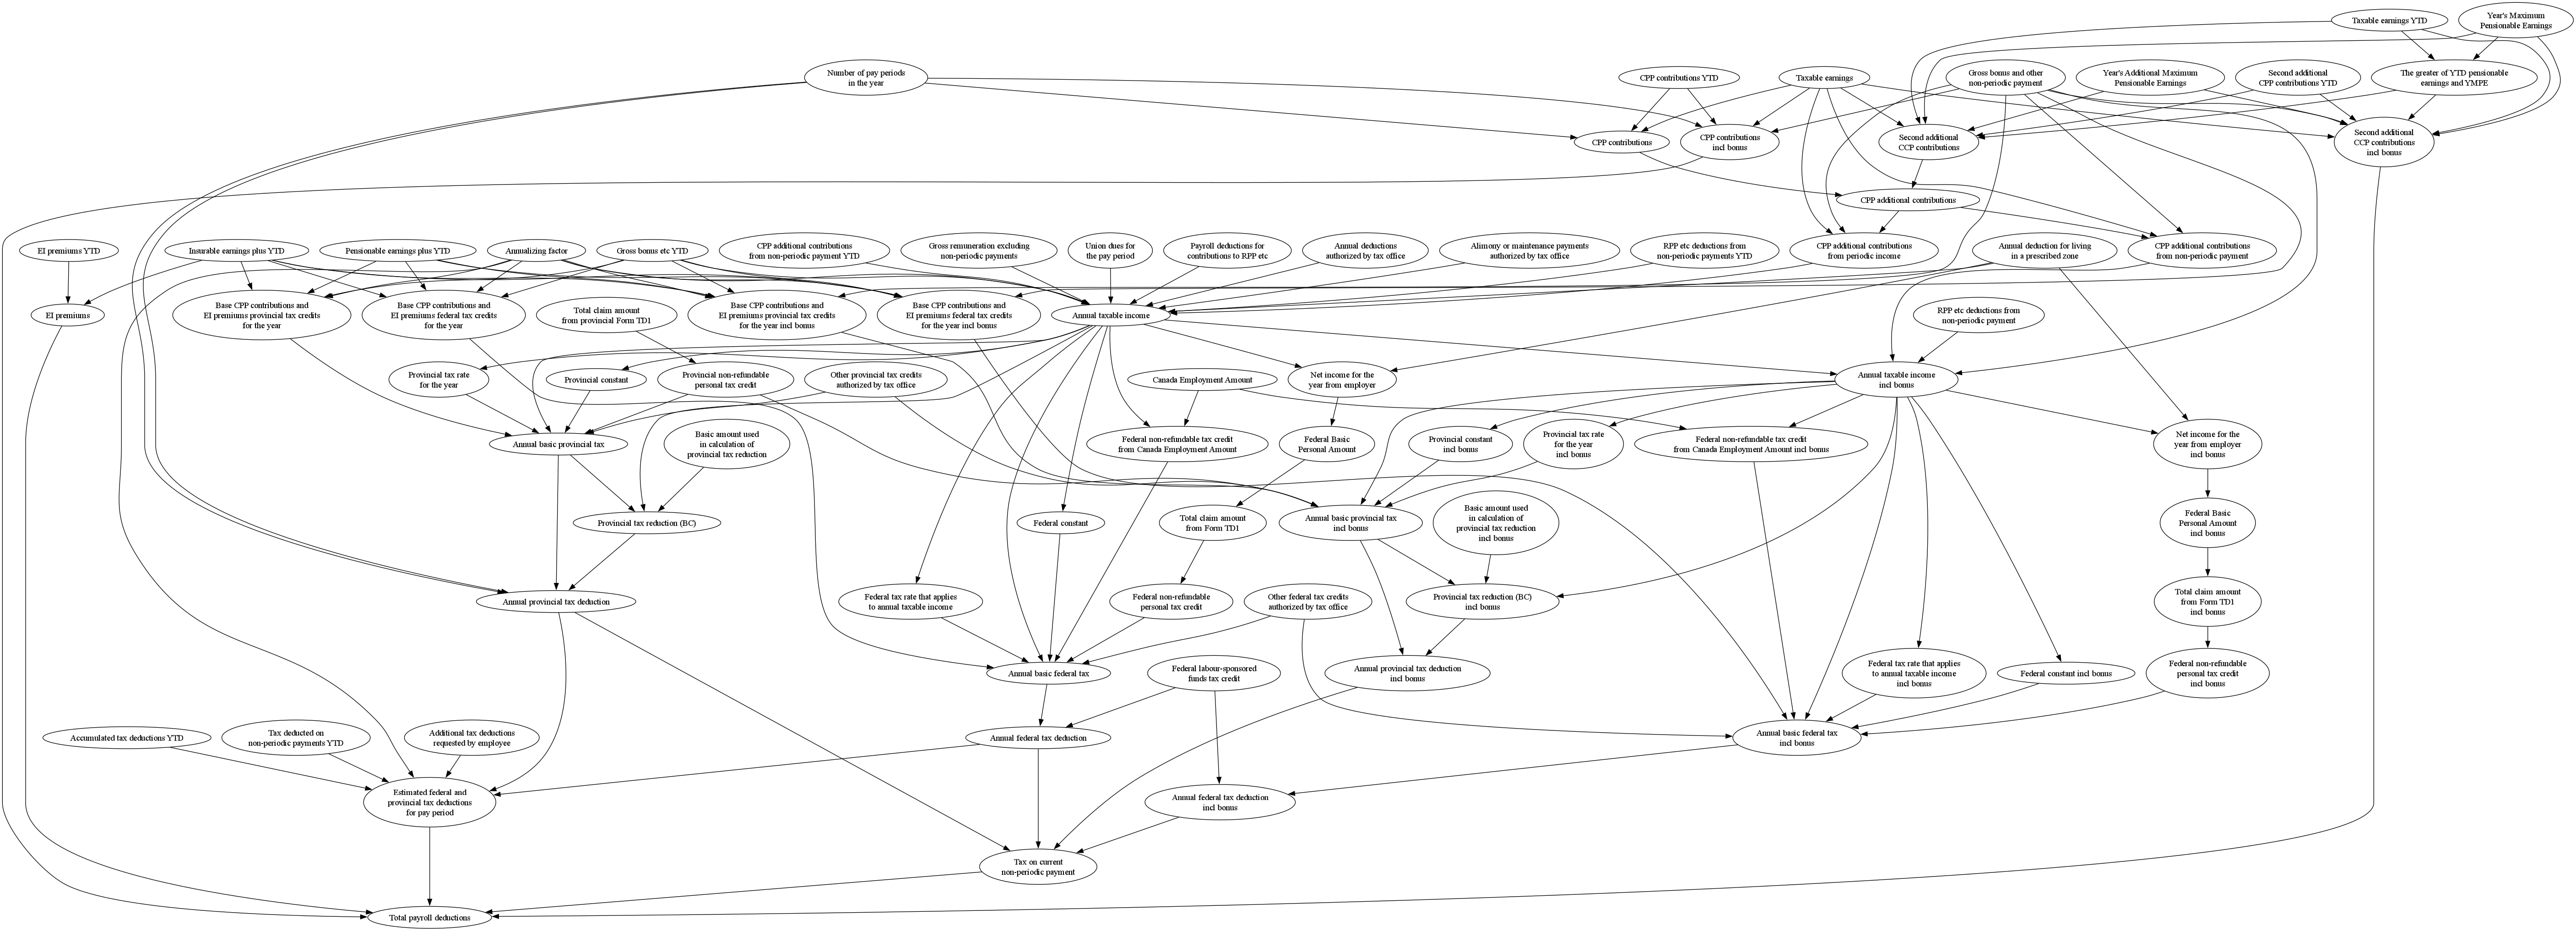
To help myself keep everything straight, I decided to draw a dependency chart using GraphViz. There are 79 nodes in the graph, starting with values like "Year's Annual Maximum Pensionable Earnings" ($73200 in the 2024 tax year), and ending up with "Total payroll deductions". Note that I did not write the formulas onto the chart — I simply recorded which other values they depend upon, so someone (aka myself) looking at the chart can figure out what to calculate first without going around in circles.
Oh, and to keep things simple, I assumed I wasn't dealing with commissioned employees, employees entering or exiting the Canada Pension Plan, or anyone resident in Quebec, Nova Scotia, Yukon, or Ontario (each of which has their own special tax complications).
Here's what it looks like; click for a full size version (warning, 5627x2033
image):